
2020-12-07
New Features
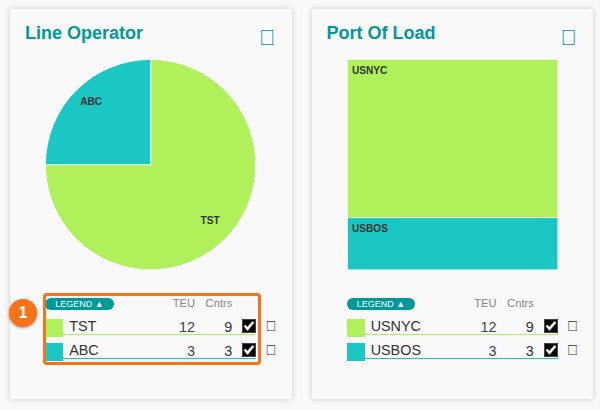
- The Dashboard opens when you first view a BAPLIE file. It now shows the number of containers next to each value. You no longer need to point at a value to see the container count. The Status chart is now a pie chart, not a bar chart. The page also fits better on screens from tablet to laptop to desktop.
- Today every chart has a menu with the choices Bar, Pie, Treemap and Legend Only. The legend of each chart shows the TEU (twenty-foot equivalent unit) and the number of containers for each value (1 in the picture). See How to use the Dashboard feature.