How to use the Dashboard feature
After you upload your file to BAPLIE Viewer Online and it has passed the file validation process, you'll be able to open up the file and view its contents.
For convenience, the first screen you are presented with is called our Dashboard. This screen automatically pulls all the data from your uploaded file and presents it in an easy to read format so you can quickly summarize and filter the cargo that is on board the vessel.

Navigating the Dashboard
The first section is the Header Details. If you need to update any of this information, you can do so by clicking on the left hand function menu under "Validation" and "Header Details". More details are available here.
The next section is the Container Count and TEU Count. The TEU is calculated on the base settings of 1 TEU for a 20 foot container, 2 TEU for a 40 foot container, and 2.5 for a 45 foot container. If you would like to update the calculations, you can do so in your settings. More details are available here.
There is also a section where, if there are data anomalies, you will be able to quickly see the data that needs your attention. More details about the Anomalies Detection algorithm can be found here.
The next section is a graphical representation of important container attributes. To navigate this data you can:
- Click on one of the data elements checkbox and exclude it from the chart.
- Doing so for one data element will also update all the other charts to exclude this same data.

- Doing so for one data element will also update all the other charts to exclude this same data.
- Clicking on the three dots icon on the top right of each chart to change the display from the current chart type to Pie, Bar, Treemap, or Legend Only.
- You can also hide/show the legend by clicking the turquoise "Legend" text
- Your chart type preferences are saved to your user profile and will automatically apply to all other files.

The chart types that BAPLIE Viewer Online provides are based on the following values and display both the TEU and Container Counts for each:
- Line Operator
- Port of Load
- Port of Discharge
- Length
- Status (Full or Empty)
- Length and Status
- Is Live Reefer
- Is Hazardous
- Is OOG
- Primary IMDG Number
Share Dashboard
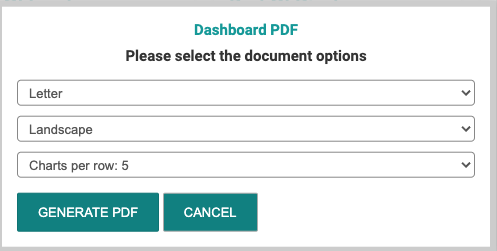
You can also download or print a PDF of the dashboard and share it with your team by using the left hand navigation bar and selecting "Export to PDF". Options on paper size, orientation and charts per row are available.